How to Calculate Sample Size for a Randomized Controlled
How to Calculate Sample Size for a Randomized Controlled Trial (RCT)
Learn how to estimate the right number of participants for your RCT so that your study is statistically powerful, ethical, and publishable.
Why Is Sample Size Important in an RCT?
In a randomized controlled trial (RCT), participants are randomly assigned to two or more groups (for example, an intervention group and a control group). The
sample size determines how confidently you can detect a real difference between these groups.
A proper sample size helps to ensure that:
- The study can detect a true effect of the intervention (if it exists).
- Results are statistically valid and reproducible.
- You avoid both Type I error (false positive) and Type II error (false negative).
- Participants, time, and money are used ethically and efficiently.
Therefore, sample size calculation is not just a technical step; it is both a
statistical and ethical requirement for any RCT.

Key Elements Required for Sample Size Calculation
Before using any formula or software, you must specify a few key design parameters. These are usually decided during protocol development, often in consultation
with a statistician.
1. Level of Significance (α) :- The level of significance (alpha, α) is the probability of rejecting the null hypothesis when it is actually true (Type I error). In medical research, it is
commonly set at: α = 0.05 (5% significance level)
2. Power of the Study (1 − β):- The power of a study is the probability of detecting a true difference if one really exists. It is equal to 1 − β, where β is the Type II error. Common choices are:
80% power (β = 0.20)
90% power (β = 0.10)
3. Effect Size :- The effect size is the minimum difference between groups that you want your trial to detect. It depends on clinical importance, not just statistics.
For continuous outcomes: difference in means (e.g., 5 mmHg change in blood pressure).
For categorical outcomes: difference in proportions (e.g., 60% vs. 80% cure rate).
4. Standard Deviation (for continuous outcomes) :- For numerical outcomes, you need an estimate of the standard deviation (σ). You can obtain this from:
Pilot studies on a small sample.
Previous published RCTs or observational studies.
5. Expected Proportions (for categorical outcomes) :- For binary outcomes (e.g., improved/not improved, alive/dead), you must specify the expected proportion in each group:
P1: proportion in the control group.
P2: proportion in the intervention group.
6. Allocation Ratio :- Most RCTs use a 1:1 allocation (equal number of participants in each group). Sometimes, you may choose a different ratio such as 2:1 for ethical, logistical,
or cost reasons. The allocation ratio directly affects the sample size per group.
Sample Size Calculation for RCTs with Continuous Outcomes
When your primary outcome is continuous (for example, blood pressure, HbA1c level, weight loss), a common formula for comparing two means with equal group sizes
is:
Formula (two-sided test, equal group sizes):

Where:
- n = required sample size per group
- σ = standard deviation of the outcome
- μ1 − μ2 = effect size (difference in means to be detected)
- Zα/2 = Z value for the chosen significance level (e.g., 1.96 for α = 0.05, two-sided)
- Zβ = Z value for the chosen power (e.g., 0.84 for 80% power)
Example: Continuous Outcome (Blood Pressure)
Suppose you want to compare blood pressure reduction between two antihypertensive drugs.
- Expected mean difference to detect: 5 mmHg
- Standard deviation (σ): 10 mmHg
- Significance level: α = 0.05 → Zα/2 = 1.96
- Power: 80% → Zβ = 0.84
Step 1: Add Z values and square them
(Zα/2 + Zβ) = 1.96 + 0.84 = 2.80
(2.80)2 = 7.84
Step 2: Multiply by 2 and by σ²
σ² = (10)2 = 100
2 × 7.84 × 100 = 1568
Step 3: Divide by the square of the effect size
(μ1 − μ2)² = (5)2 = 25
n = 1568 / 25 = 62.72
You always round upwards, so each group will need 63 participants. The total sample size will be:
63 + 63 = 126 participants.
Sample Size Calculation for RCTs with Categorical Outcomes
When your outcome is categorical or binary (for example, cured/not cured, controlled/uncontrolled blood pressure), you compare two proportions.
Formula (two proportions, equal group sizes):
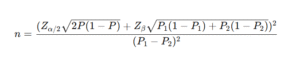
Where:
- P1 = expected proportion in the control group
- P2 = expected proportion in the intervention group
- P = (P1 + P2) / 2
Example: Categorical Outcome (Recovery Rate)
You want to compare recovery rates between an intervention and a control group.
- Expected recovery in control: 60% → P1 = 0.60
- Expected recovery in intervention: 80% → P2 = 0.80
- Significance level: α = 0.05 → Zα/2 = 1.96
- Power: 80% → Zβ = 0.84
First, compute average proportion P:
P = (0.60 + 0.80) / 2 = 0.70
Then substitute into the formula:
n ≈ [ 1.96 × √(2 × 0.7 × 0.3) + 0.84 × √(0.6 × 0.4 + 0.8 × 0.2) ]² / (0.2)²
After calculating the values, you will get approximately:
n ≈ 82 participants per group
So, the total required sample size is about 164 participants (82 in each arm).
Accounting for Dropouts and Non-Compliance
In real-world RCTs, not all participants complete the study. You should inflate the calculated sample size to account for dropouts, non-response, or protocol violations.
Adjusted sample size:
Adjusted n = n / (1 − dropout rate)
For example, if you need 100 participants per group and expect a 10% dropout rate:
Adjusted n = 100 / (1 − 0.10) = 100 / 0.90 ≈ 111.1
So, you should recruit 112 participants per group.
Sample Size Calculation Using Software
While manual formulas are useful for understanding the logic, most researchers now rely on software to compute sample size more quickly and accurately, especially when designs are complex.
Free Tools
- OpenEpi – web-based tool for epidemiological calculations.
- Epi Info – from the CDC, includes tools for sample size and power.
- G*Power – versatile software for many types of power analyses.
- R – packages such as
pwrand others can be used for custom sample size calculations.
Paid / Advanced Options
- STATA – has built-in commands for power and sample size.
- SPSS SamplePower – specialized module for sample size planning.
statistical software, you can ensure that your RCT is:
- Statistically powerful enough to detect meaningful differences,
- Ethically justified in its use of participants and resources, and
- More likely to produce reliable, publishable evidence.
Whether your primary outcome is continuous or categorical, understanding the logic behind sample size formulas helps you design a
scientifically strong and ethically sound RCT.